Photon rain statistics
An analysis of random Poisson noise
Following discussion with Mr. Pavel concerned on likelihood analysis of Fermi’s data (see also the general description of likelihood analysis) and a creation of an illustration for Practicum, I created a toy model demonstration of capture of photons by event-counting area detectors. The key property of a fictions detector is to collect photons during unique time-samples by increasing pixel value in a random place. We can metaphorically designate the model as a photon raining detector.
More precisely, the algorithm can be represented as (sources: ccdnoise.tar.gz):
- start
- generate random X coordinate
- generate random Y coordinate
- add +1 to pixel on X,Y
- back to 0.
(All, that’s all).
The probability of capture of an event in the time period is given by Poisson distribution
p_k (fT) = (fT)^k e^(fT) / k!
- the p_k is probability of capturing of k-photons during time period T when averaged flux is f photons per time unit
- the events are statistically independent (photons doesn’t interacts)
- consequence is that the zero, one, or more photons can be captured in a single pixel during T
Final results has been displayed in following animations. Both show imaginary detector on the left and empirical distribution - histogram (number of detections in a given level) of photons.
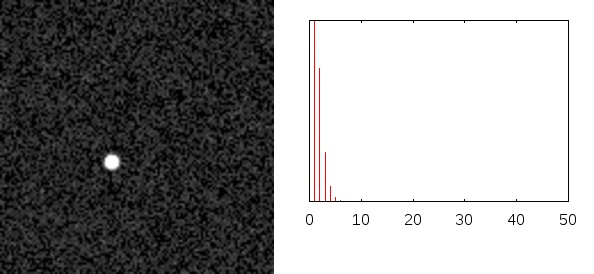
Shortly after star animation
The first animation shows state shortly after start of raining. We can see:
- the noise in start is relative huge, noise disappear with time
- the mean gray goes from black to (light-)gray
- the distribution histogram is highly non-symmetrical shortly after start
- mean of the distribution increases proportionally to time
- the distribution metamorphosing from Poisson to Gaussian
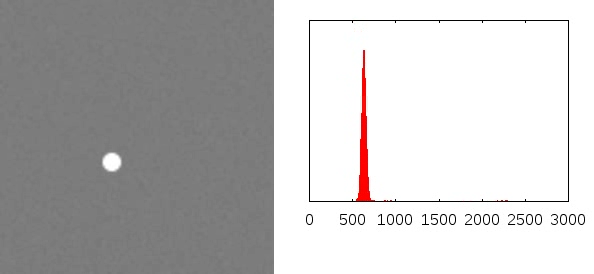
Second animation shows status on a long-term scale:
- the noise is strongly reduced, practically disappear with time
- the noise is not visible at end of simulation (uniform color)
- the width of distribution increases with time,
- but relative uncertainty decreases as sqrt(t)/t suppressing noise
- distribution histogram approaching Gaussian, very nice illustration of the law of large numbers
Note that imaging has been set to show increasing mean during first animation and reducing relative noise during second animation.
After long time animation.
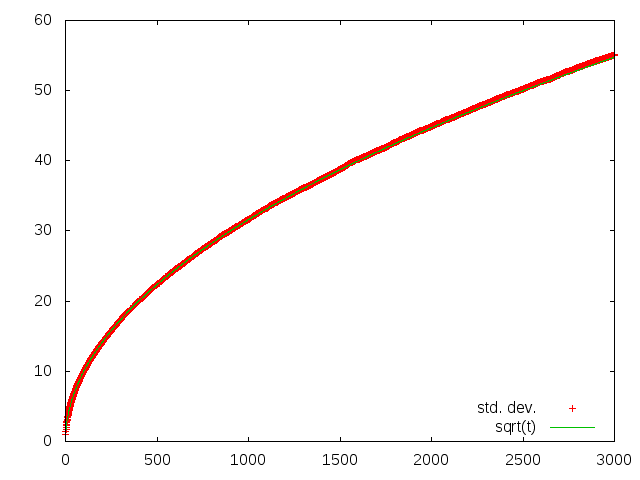
Along with the animations, I computed mean and standard deviation of rain. The results are in graph. The standard deviation is perfectly fitted by square root. One is excellent demonstration of the important property of Poisson distribution.